Problem
We run many internal and customer applications, in our cloud infrastructure that has many servers, creating a huge amounts of log data. Many text files across many computers and docker containers make searching and debugging very difficult.
The logs can be hard to access unless you have shell access to the server and container. Providing this level of access is complex and difficult. Many project team members need access to these logs to support, monitor and debug application issues.
Solution
Gerhard Hipfinger investigated and evaluated various logging infrastructure solutions including the established ELK (Elastic Logstash Kibana) based solutions. However the Loki and Grafana prototype he presented to our DevOps team was very well received. Its main advantages were:
-
oAuth Single Sign on via Keycloak and Grafana.
-
Familiar and simple user interface in Grafana.
-
Simple log processing and collection with Promtail.
Implementation
Loki stores and indexes the log data and provides a query interface.
Promtail collects, interprets and posts log file data to Loki.
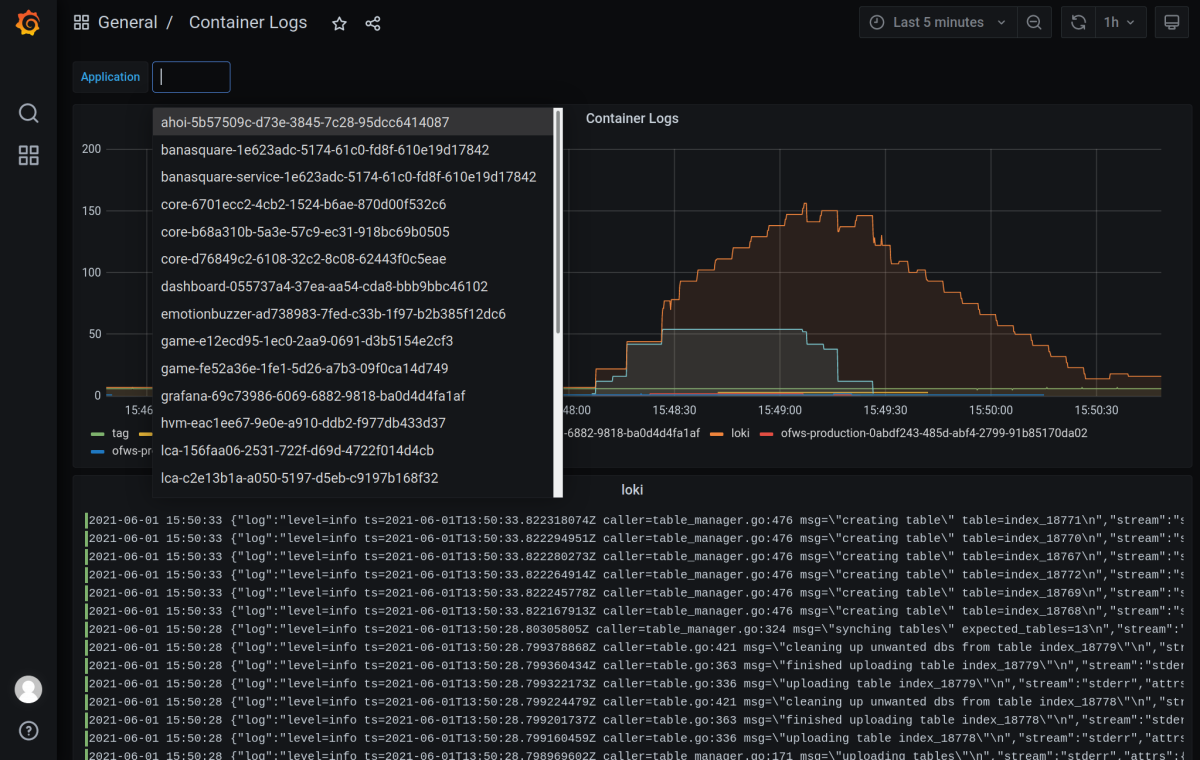
Grafana queries Loki to retrieve log data for presentation in custom dashboards.
We configure our cloud infrastructure using Ansible. It allows us to configure many servers accurately and consistently. The promtails.conf Ansible template configures the Promtail service to collect system logs and Docker container logs, as well as defining the labels for the Loki indexes.
$ cat conf/promtail/docker-config.yaml
server:
  http_listen_port: 9080
  grpc_listen_port: 0

positions:
  filename: /tmp/positions.yaml

clients:
  - url: {{ loki_url }}

scrape_configs:

- job_name: system
  static_configs:
  - targets:
      - localhost
    labels:
      instance: {{ inventory_hostname }}
      job: varlogs
      __path__: /var/log/*log

- job_name: containers
  static_configs:
  - targets:
      - localhost
    labels:
      instance: {{ inventory_hostname }}
      job: containerlogs
      __path__: /var/lib/docker/containers/*/*log

  pipeline_stages:

  - json:
      expressions:
        stream: stream
        attrs: attrs
        tag: attrs.tag

  - labels:
      tag:
      stream:
In order to get a human readable application name in the Loki tag index for the Docker containers, we needed to configure the log options "tag" in the Docker daemon json to be the container ".Name".
$ cat conf/docker/docker-daemon.json
{
  "log-driver": "json-file",
  "log-opts": {
    "max-size": "10m",
    "max-file": "5",
    "tag": "{{.Name}}"
  }
}
In Grafana we can then see the system logs
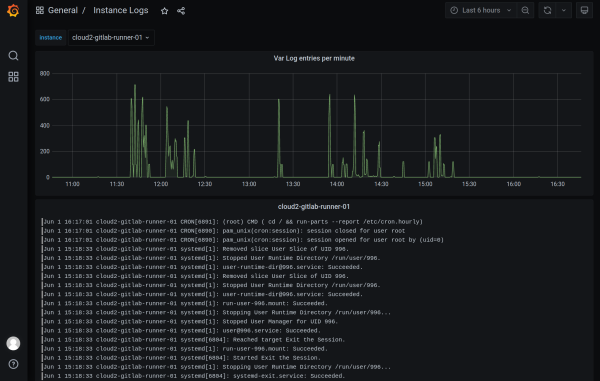
System Logs
and the Docker container logs

System Logs
##Conclusion We now have a logging infrastructure component that is easy to roll out to many servers and containerised applications with minimum effort. Grafana provides a flexible UI for creating custom dashboards that can be used by all team members. I am really happy with this solution. I think that the ease of maintaining and using it means that will hopefully have a better team adoption than other more complex Kibana based solutions that we have used in the past.
The simple things in life are often the best.
